
Objective
To collect a set of personal data over 14 days to tell a story about yourself in a unique way and present it in a visually pleasing way.
Solution
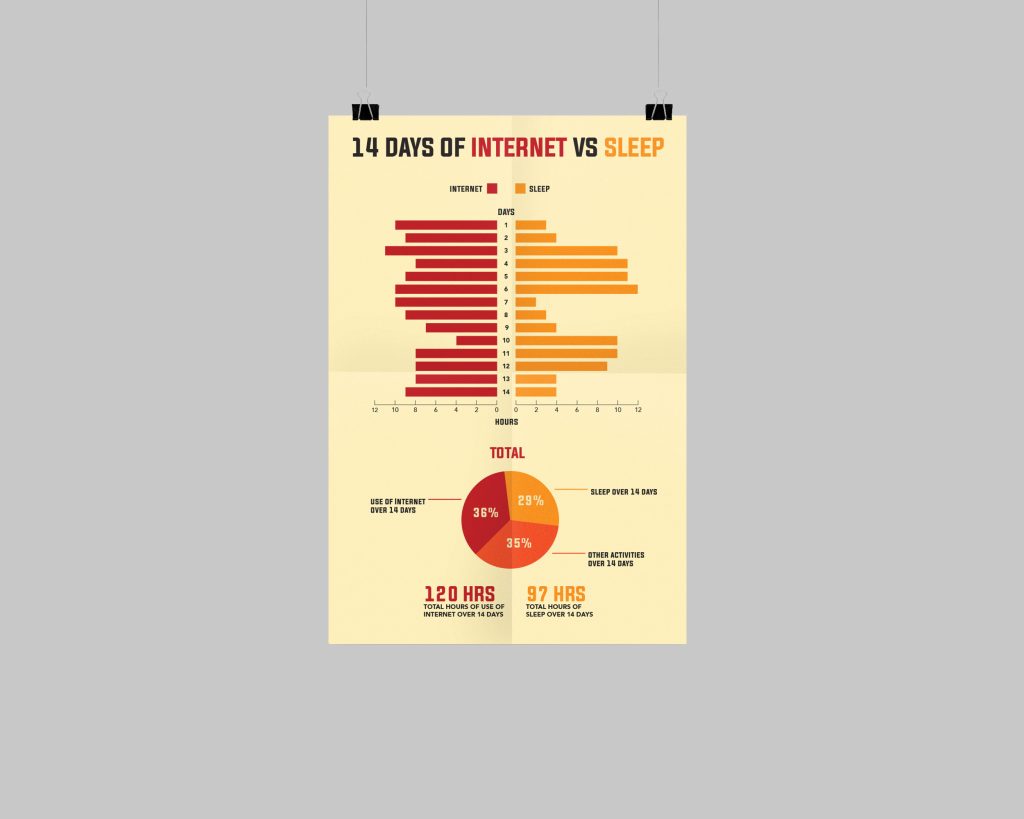
The topic I chose is how many hours I had spent between being on the internet and sleeping for two weeks. Once the data was collected I felt that it would be appropriate to present the hours in a bar graph each day and a circle graph for the total hours by percentage. I also added a warm color scheme to differentiate between internet vs. sleep.